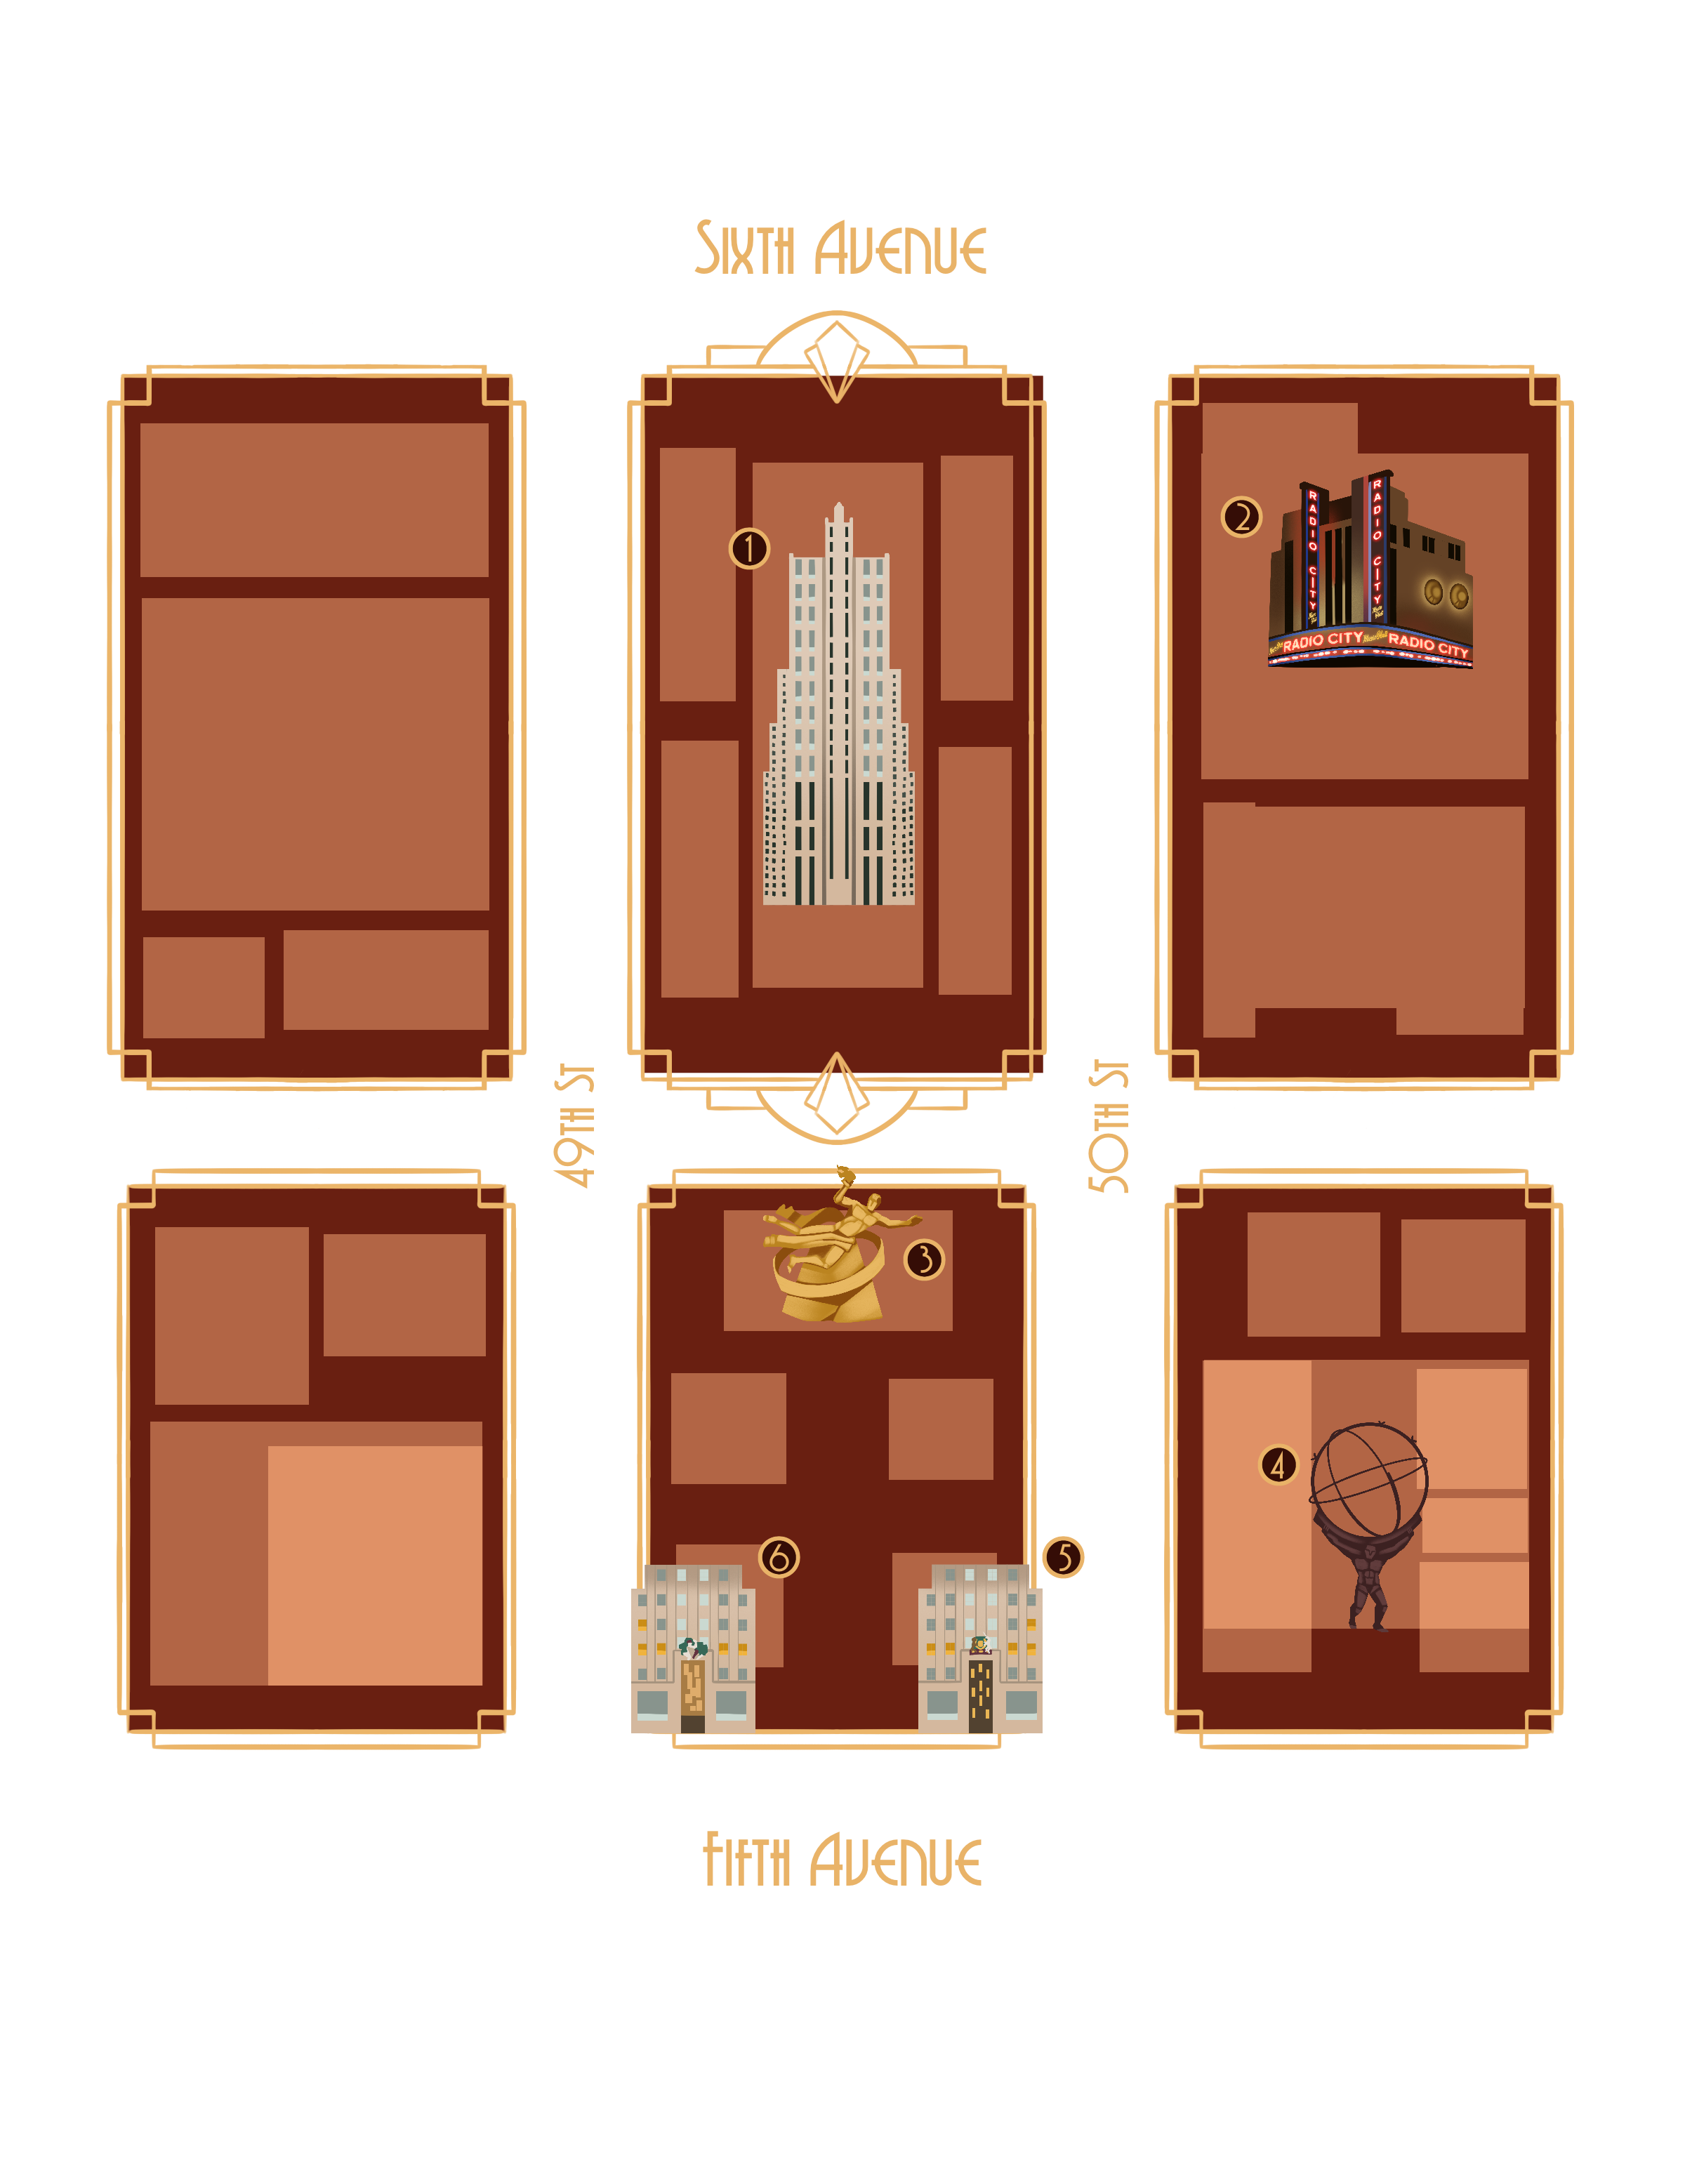
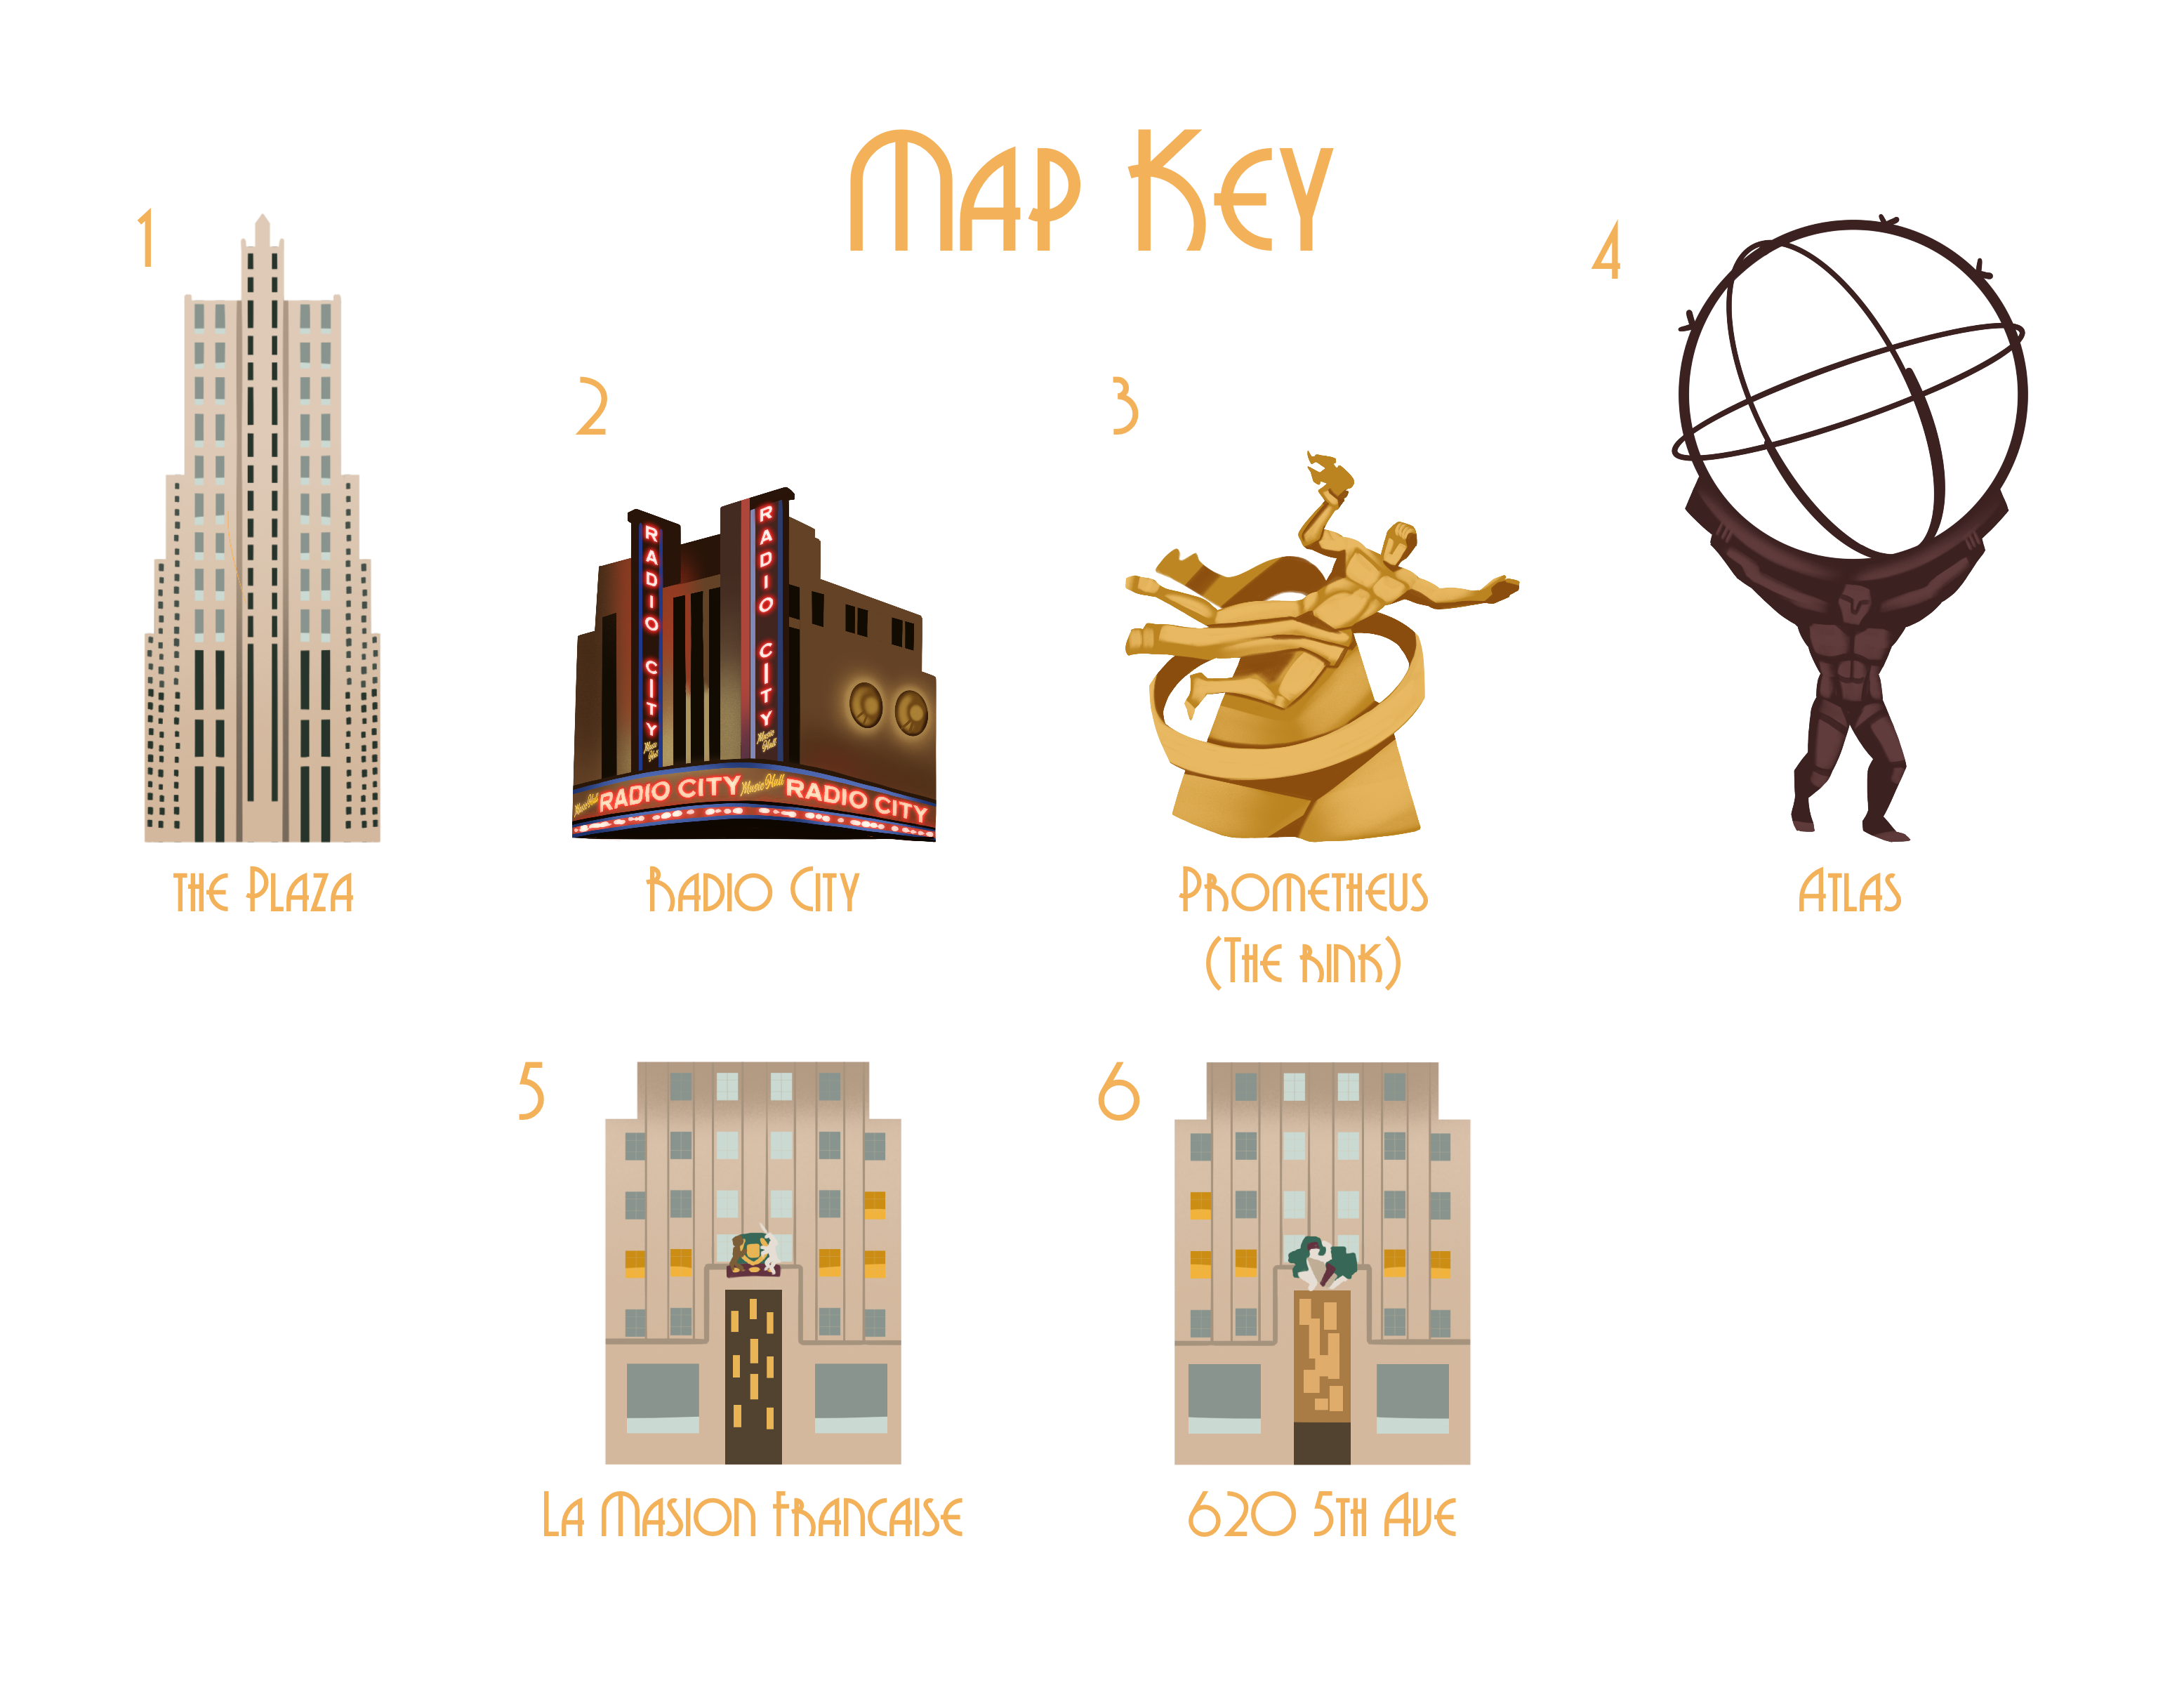
Here is a stylized map of my location. Rockefeller Center spans several blocks with multiple buildings and art deco landmarks, such as Atlas and Prometheus.
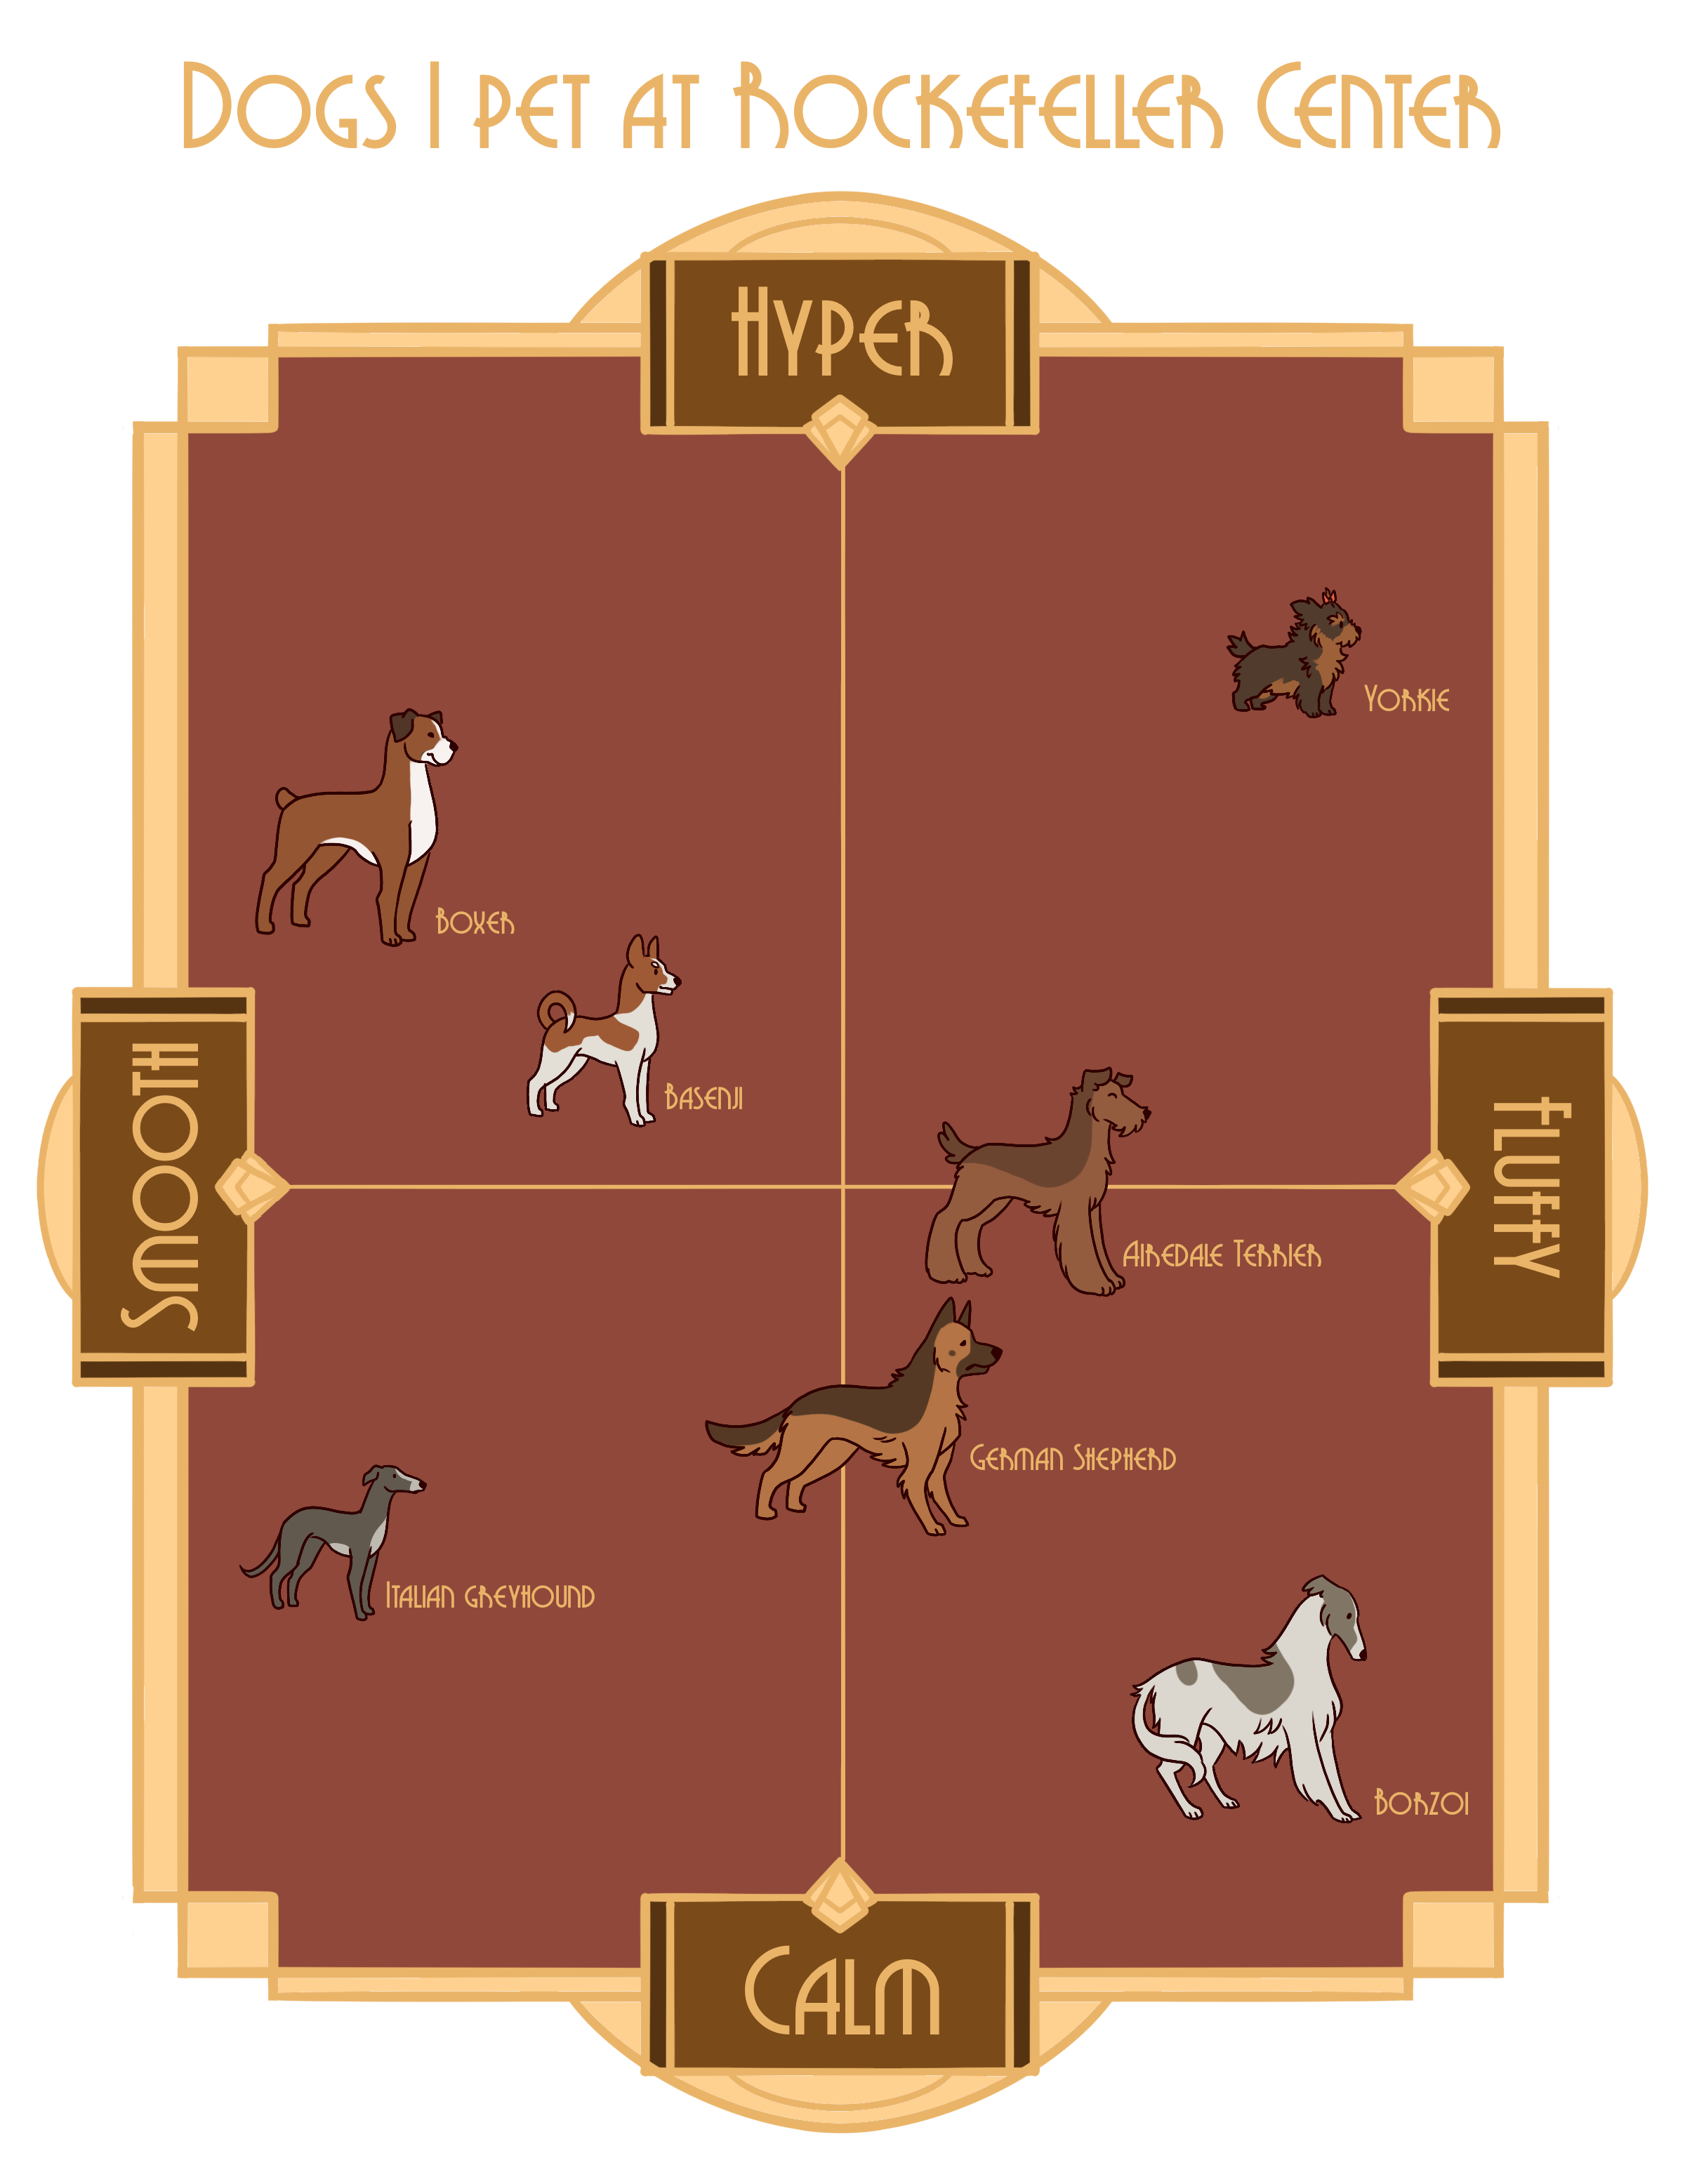
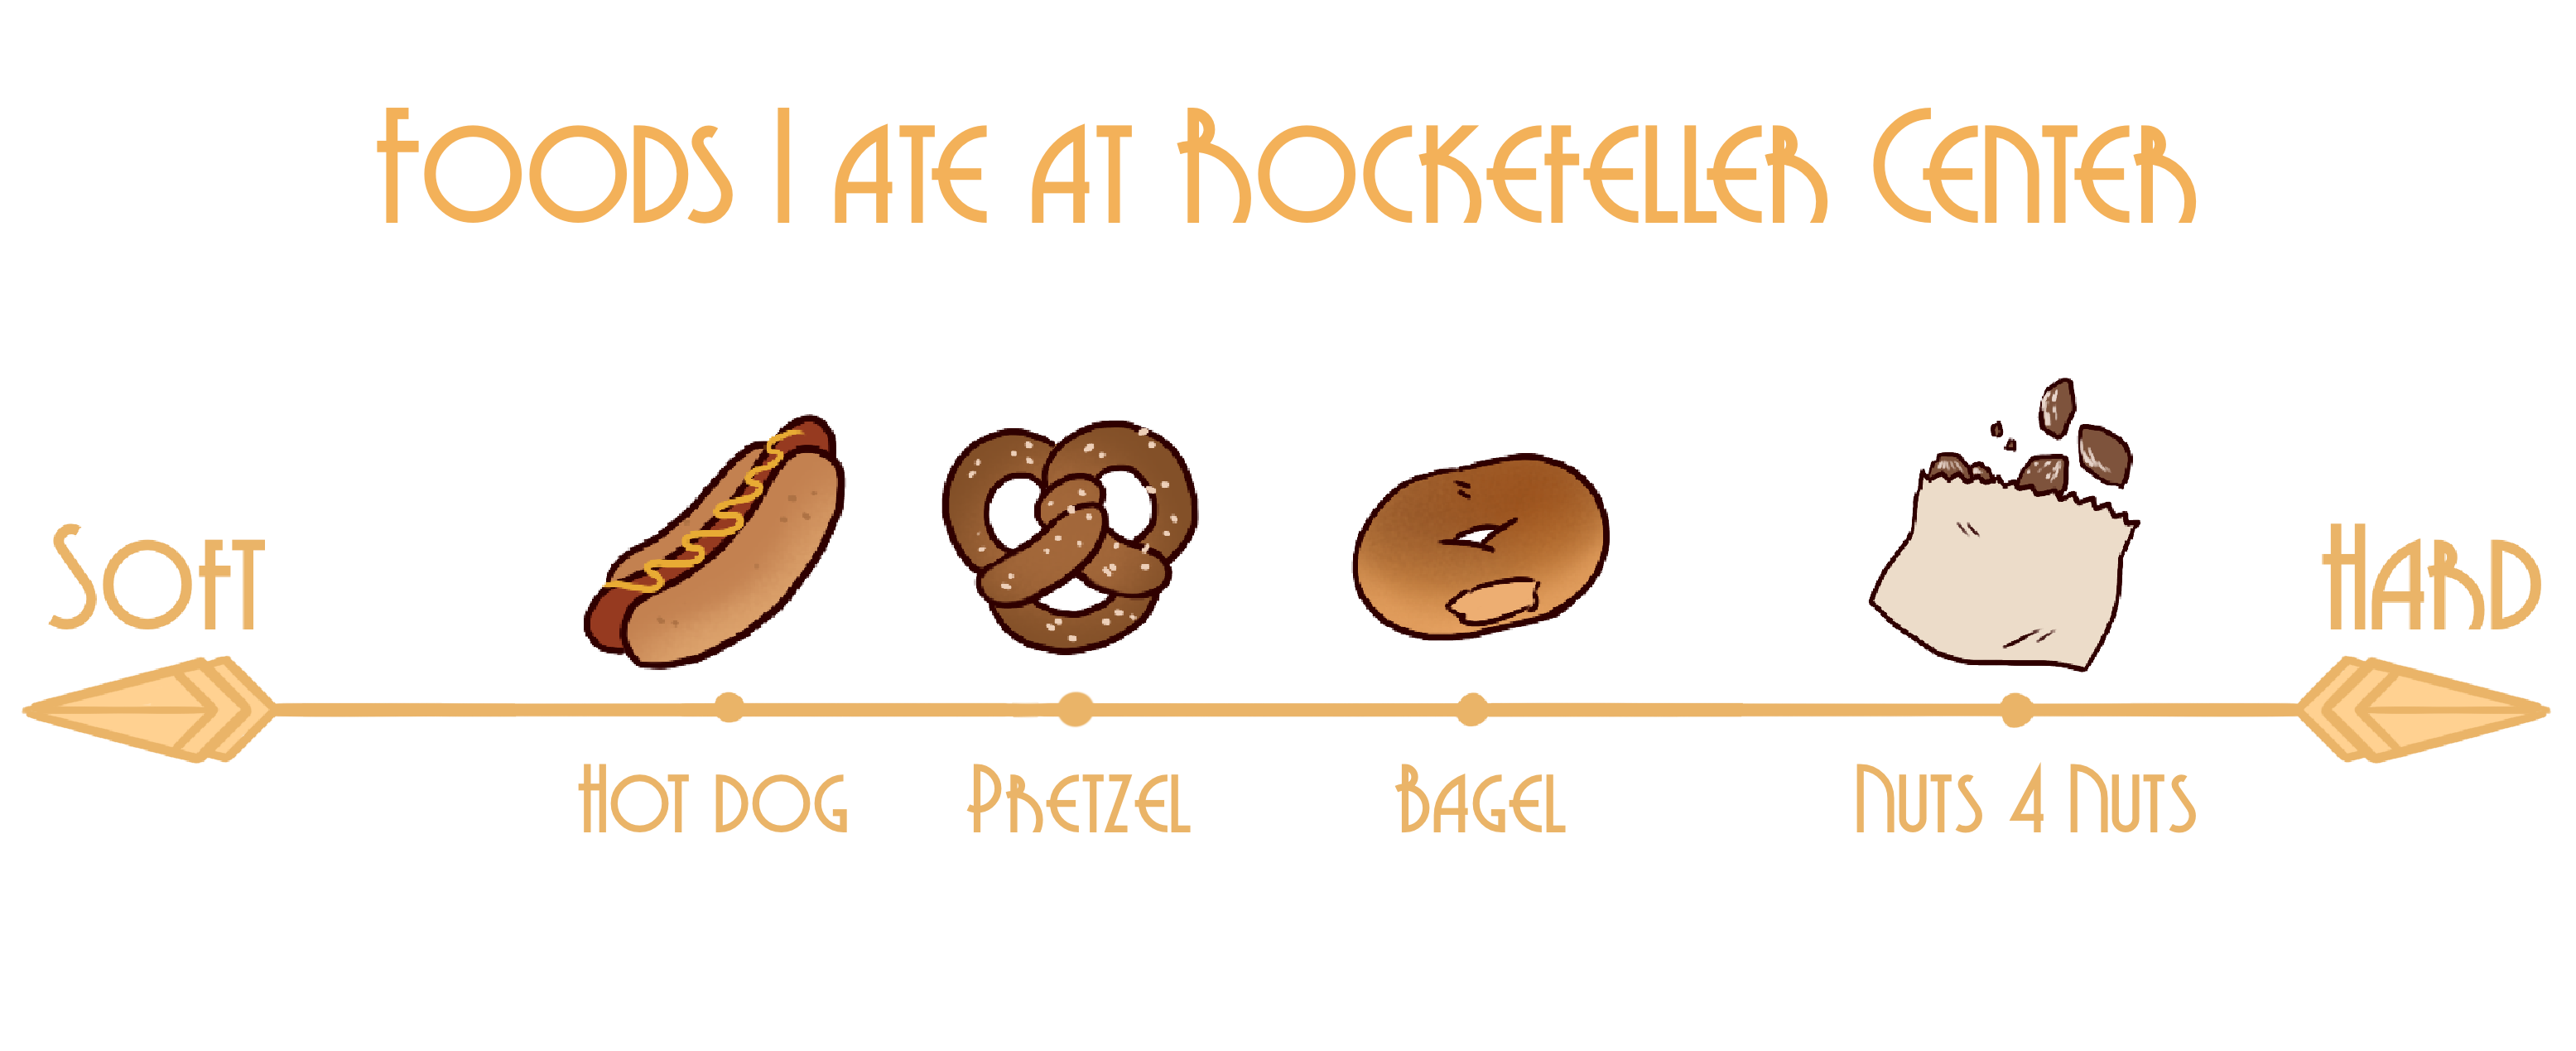
In my location, I had to combine my senses and use them to make different graphs and charts. For my first, I decided to go with touch, and document all of the dogs I pet at the center. My chart categorised them by their coats (fluffy to smooth) and their energy (calm to hyper.) My second chart was of various foods I ate while there, ranging from hard to soft.
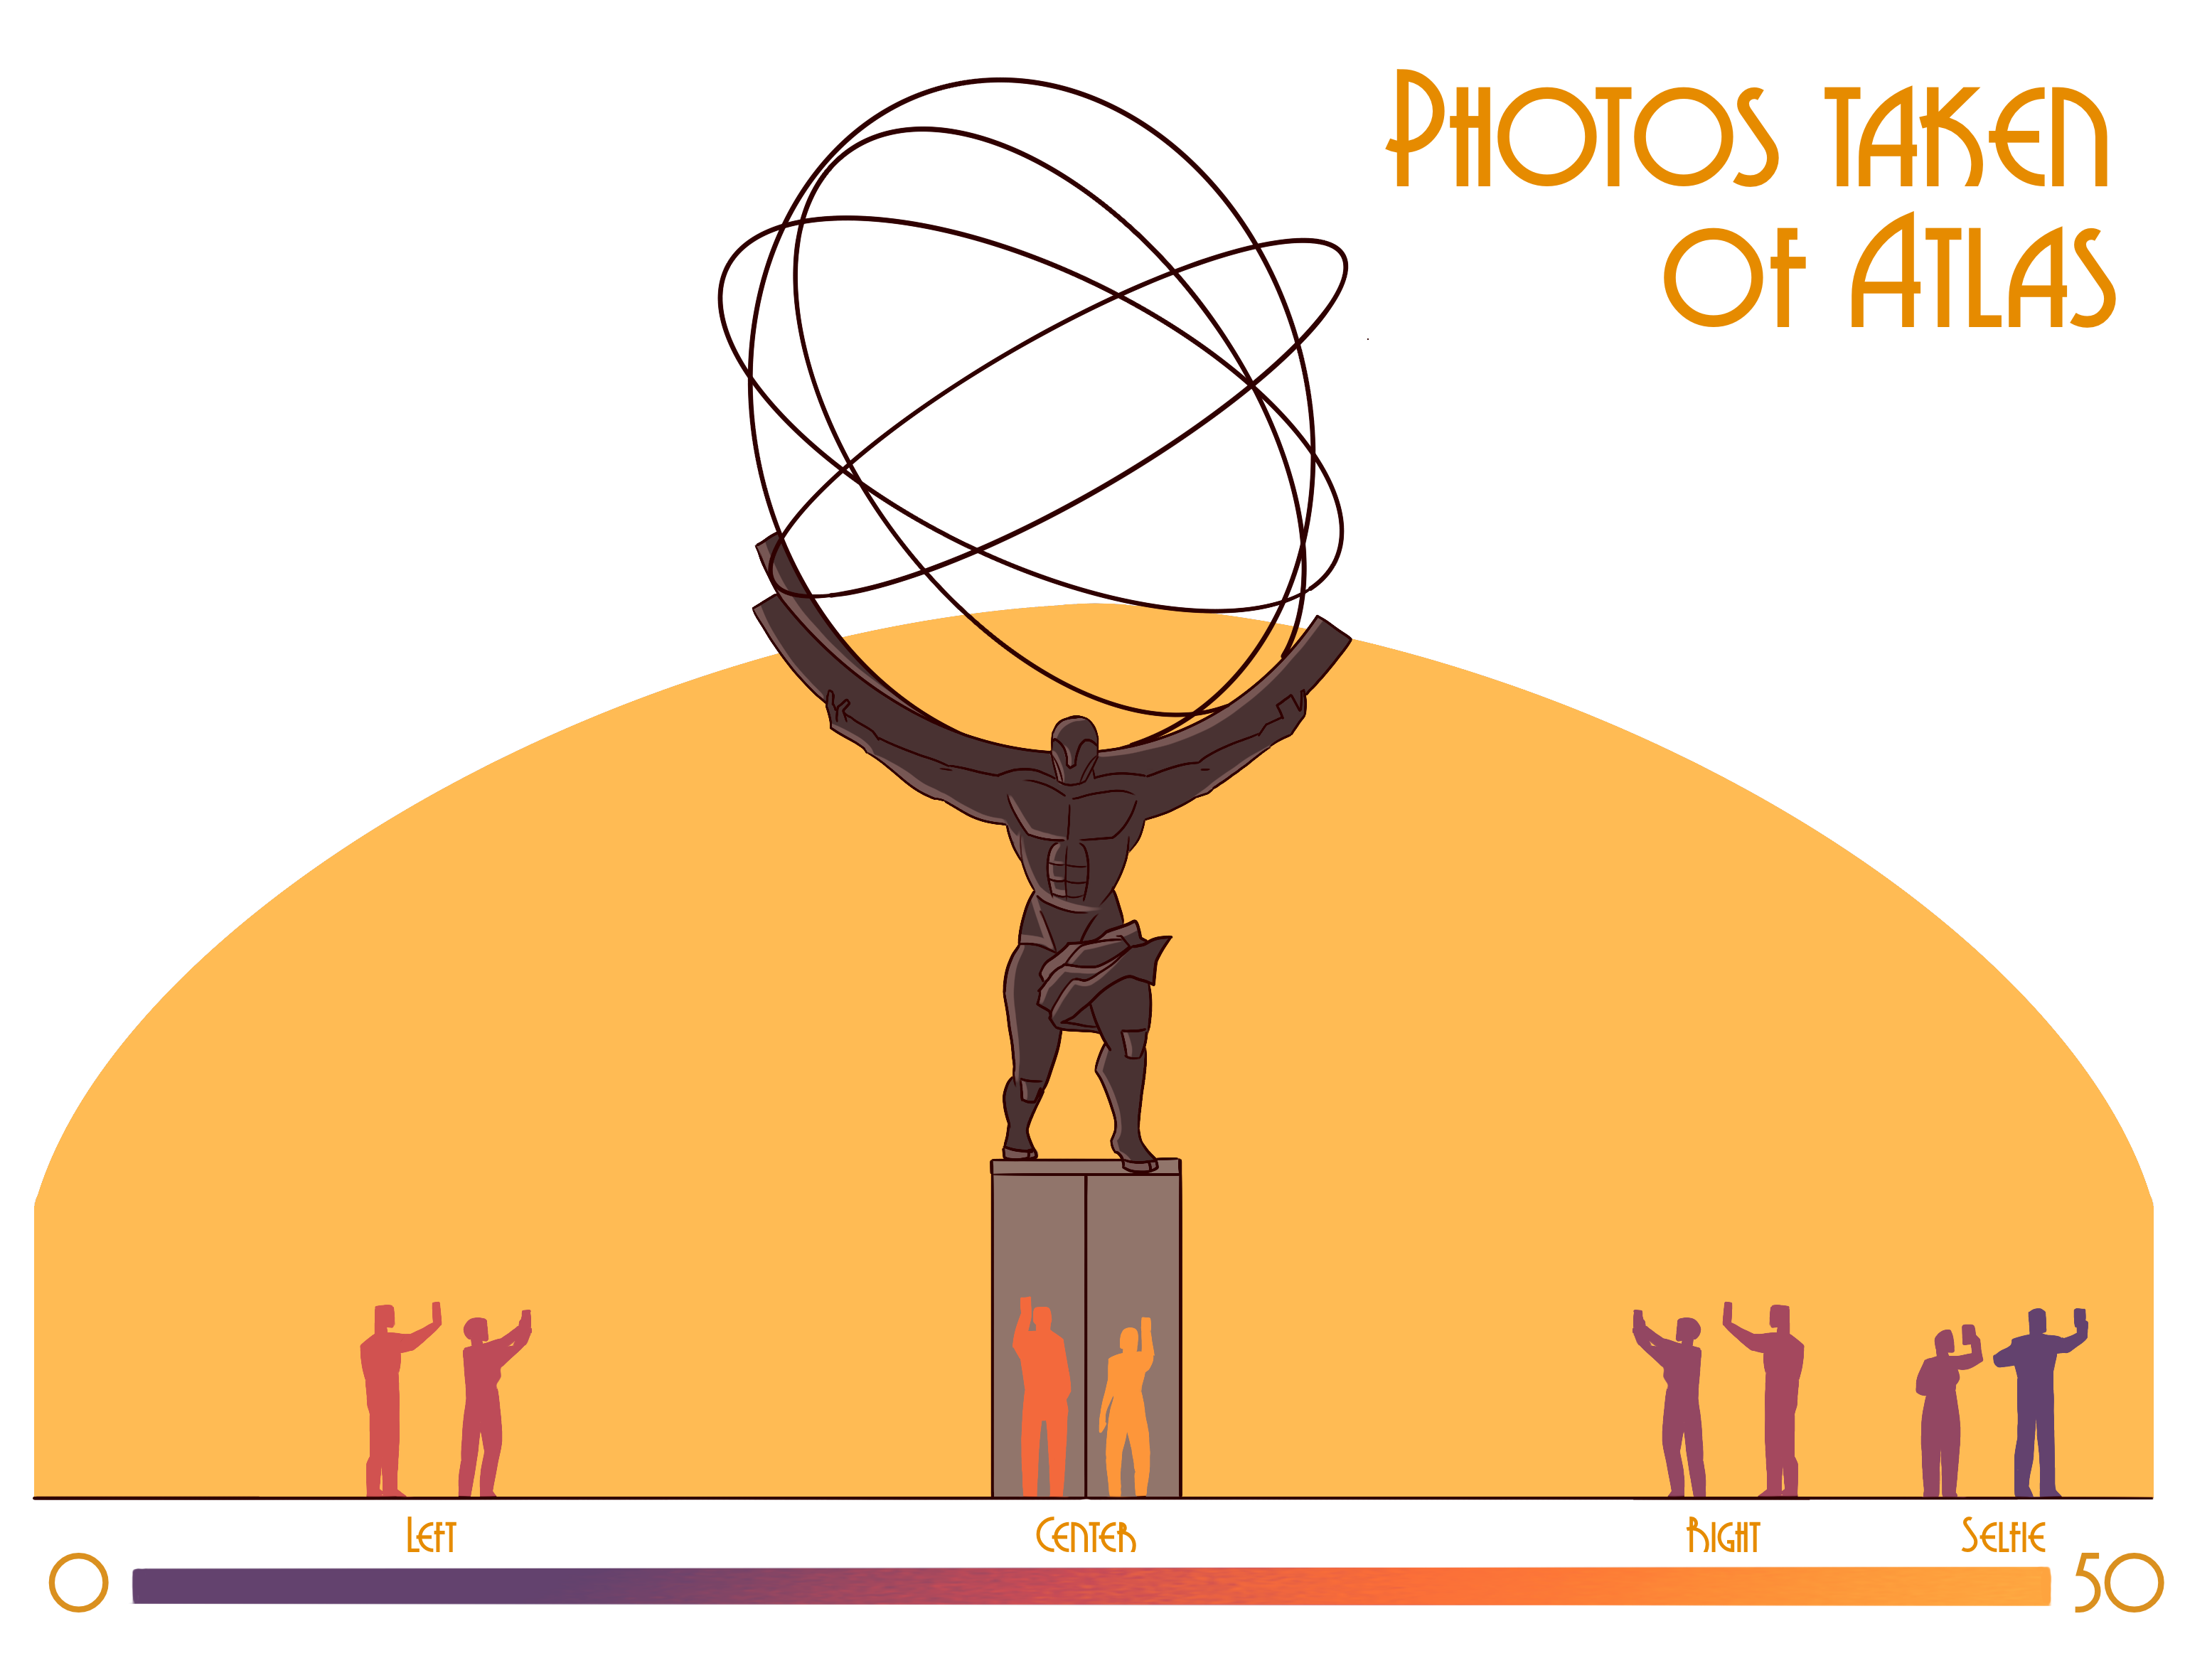
For 50 minutes, I documented how many people took photos of Atlas, and graphed the position they took them at. The chart displays both men and women, and how many photos each gender took in each position.
Sofia Musacchia, 2026